Region and Element Screenshots in Vynix
Screenshots are useful, but a plain screenshot often leaves developers guessing. Vynix connects the visual bug report to the page element, browser context, console output, network activity, and an AI diagnosis so a developer or coding agent can start from the real problem instead of a vague description.
Why ordinary screenshots lose important context
A screenshot tells you what someone saw, but not always why it happened. If a button is clipped, a dropdown opens behind a modal, or a price label wraps onto two lines, the image shows the symptom. It usually does not show which element was involved, what CSS was applied, whether a request failed, or whether an error hit the console at the same time.
This gap gets bigger when the person reporting the bug is not the person fixing it. A product manager might write, "The checkout button is broken on the pricing page." A developer then has to ask which browser, which plan card, which viewport, whether the button was disabled, and whether there were errors. Vynix is built to shorten that loop. You drop a lightweight widget on the site, click on what is wrong, and capture the visual state along with developer context.
- A screenshot shows the visual symptom, not the code path.
- A written bug report often misses the exact element that caused the issue.
- Console and network context can explain visual problems that are not visible in the image.
- A report is easier to act on when the selected element and screenshot are captured together.
What region and element screenshots capture
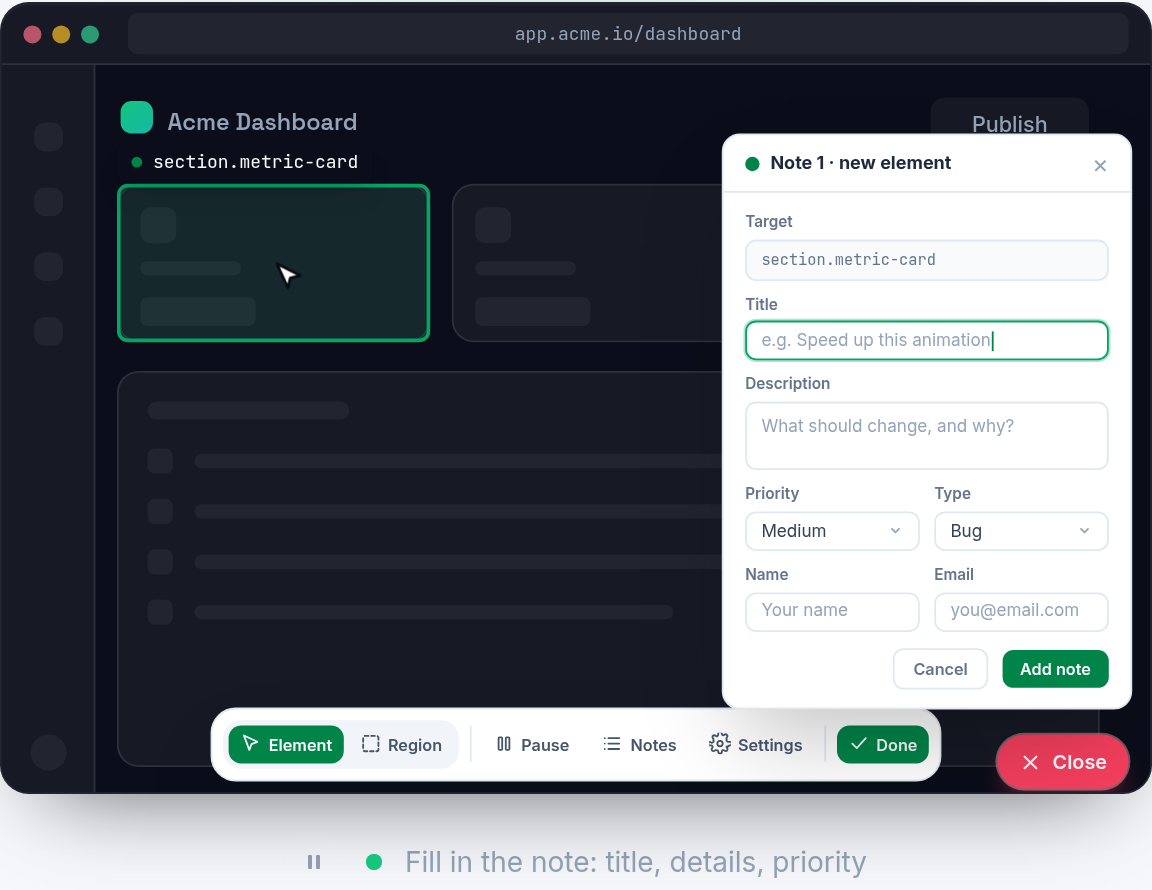
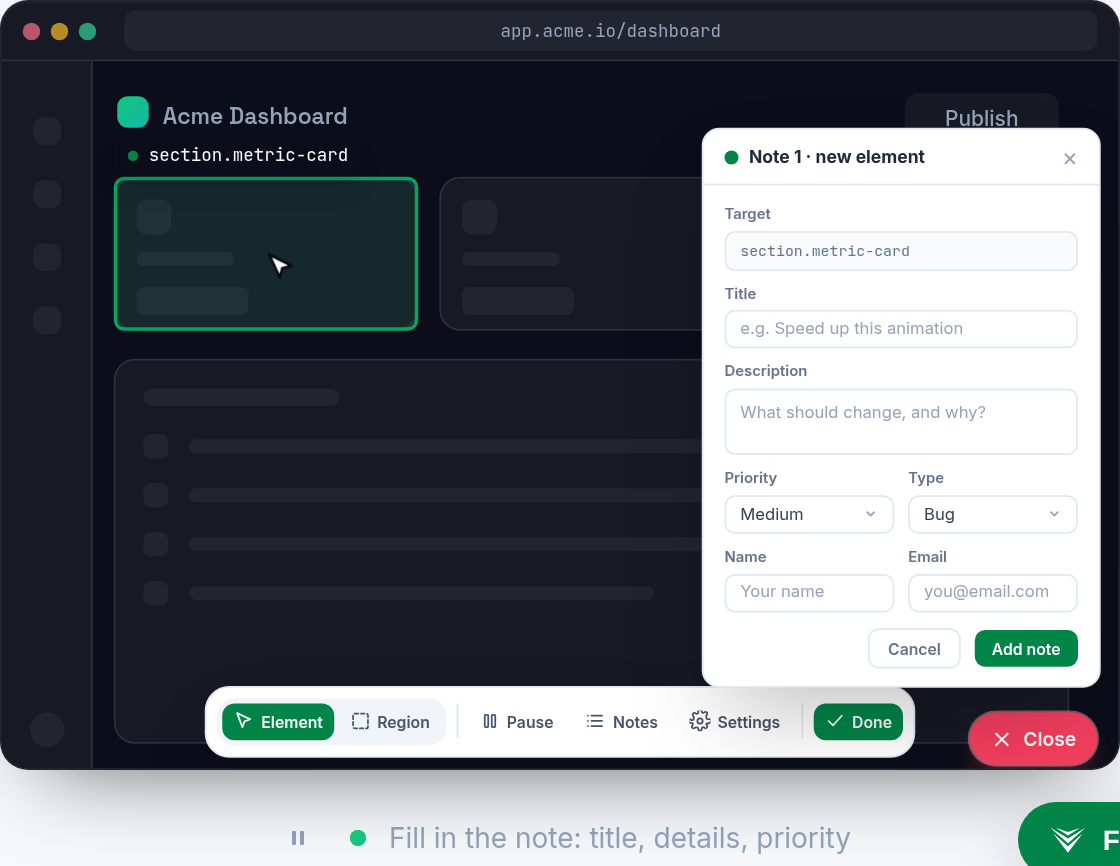
Region and element screenshots solve different parts of the same problem. A region screenshot gives the surrounding visual area, which helps a developer understand layout, spacing, stacking, and nearby content. An element-focused capture ties the report to the specific thing the reporter clicked, such as a button, input, card, menu item, image, or banner.
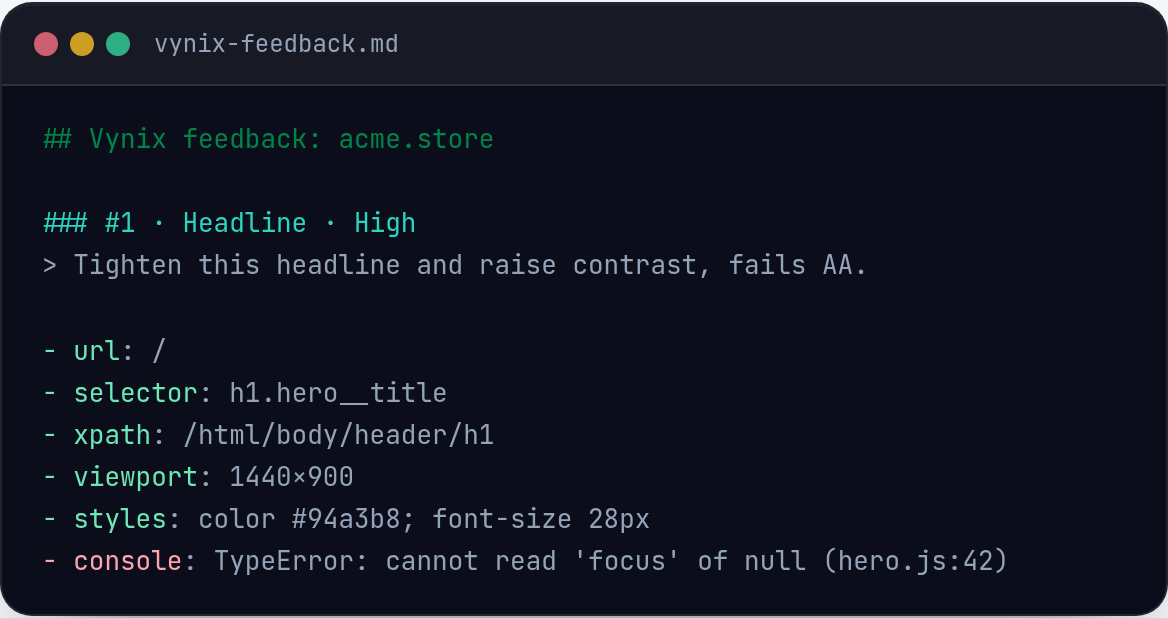
In Vynix, the click matters. Instead of asking someone to describe the broken area in a comment, Vynix lets them point at the problem on the live page. The capture can include the element, a screenshot, console context, network context, and an AI diagnosis of the likely root cause. That combination is much better than an image named screenshot-27.png in a chat thread.
- Use the region view to understand the visible page state around the issue.
- Use the selected element context to know which part of the DOM was reported.
- Use console context to spot runtime errors near the moment of capture.
- Use network context to see whether missing or failed data may have caused the UI state.
- Use the AI diagnosis as a starting point, then verify it in code.
How Vynix turns a click into developer context
The normal workflow is simple. A widget is added to the site, a teammate opens the page, and they click on the thing that looks wrong. Vynix collects the visual and technical context around that report. The important detail is that the report starts from the selected element, not from a blank text field.
That makes the report easier to read and easier to route. A broken navigation item may point toward routing or CSS. A disabled submit button may point toward validation state, a failed API call, or missing data. A blank product grid may point toward the network tab rather than the React component that renders the list. Vynix does not replace debugging, but it helps the person debugging start closer to the failure.
- Install the lightweight widget on the site you want to annotate.
- Open the page where the issue appears.
- Click the incorrect element or visible region.
- Review the captured screenshot, element context, console output, and network context.
- Copy a ready-to-build prompt or open a GitHub issue and assign it to a coding agent.
Example: an empty table caused by a failed request
Visual bugs are not always caused by CSS. Imagine an admin page where a table area is empty, but the page frame, filters, and toolbar all render correctly. A screenshot alone might lead someone to inspect the table component first. The real cause could be a failed API request, an authorization problem, or an unexpected response shape.
When the reporter clicks the empty table region in Vynix, the captured context can include network activity near the report. If a request failed, timed out, or returned a response the UI did not handle, that context belongs in the bug report. The screenshot still matters because it shows exactly what the user saw, but the network context may explain why the table had no rows.
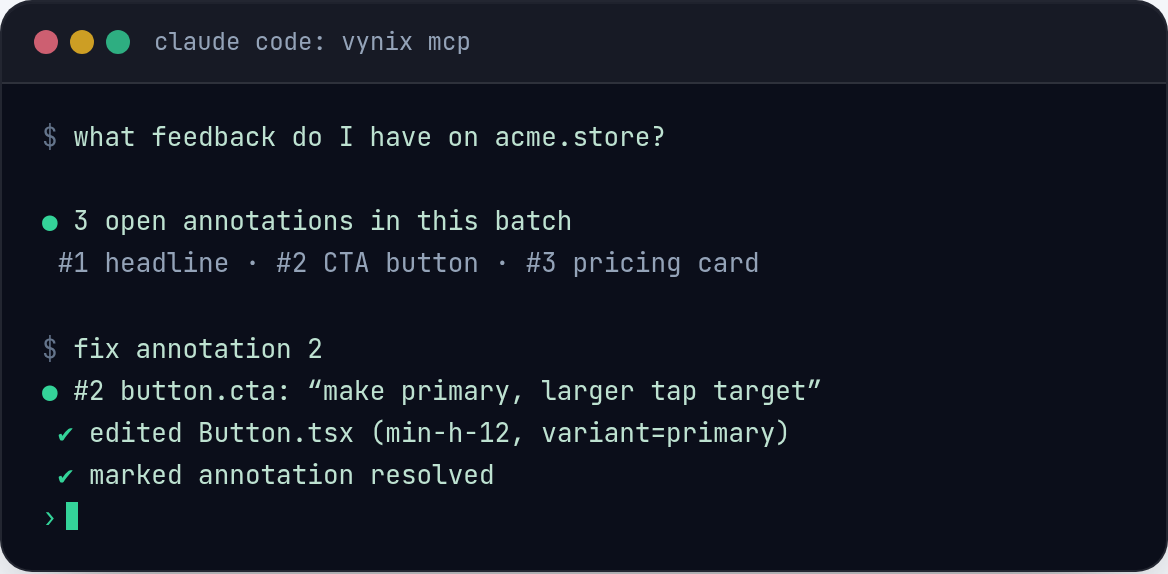
This is where Vynix is useful for coding agents too. A prompt that says "fix empty admin table" is weak. A prompt that includes the selected region, the visible state, the related network failure, console output, and an AI diagnosis gives the agent a much better starting point.
- The visual symptom is an empty table.
- The likely cause may be outside the table component.
- Network context can reveal failed or unexpected data loading.
- The copied prompt can carry both the screenshot context and the technical clues.
Writing better issues from screenshot captures
A good issue should be specific enough that the next person can act without asking basic follow-up questions. Vynix helps because the reporter does not have to manually gather every clue. After the capture, they can copy a ready-to-build prompt or open a GitHub issue and assign it to a coding agent.
The best reports still benefit from a short human note. The screenshot and element context show what happened, but a sentence about the expected behavior removes ambiguity. For example, write "The menu should open above the footer on mobile" instead of "Menu broken." Write "The save button should become enabled after a valid email is entered" instead of "Button does not work."
The goal is not to create longer tickets. The goal is to create tickets that carry the right evidence. Region and element screenshots give the visual proof. Console and network context give technical clues. The AI diagnosis gives a likely direction. The developer or coding agent still owns the fix, but the handoff starts in a better place.
- Name what is wrong in one sentence.
- Add the expected behavior if it is not obvious from the screenshot.
- Keep the Vynix-captured context attached to the issue or prompt.
- Avoid rewriting browser logs by hand when they are already captured.
- Treat the AI diagnosis as a helpful lead, not as final proof.
- Region screenshots show the visible page state around a bug, while element context identifies the exact part of the page that was selected.
- Vynix captures more than the image, including console and network context plus an AI diagnosis of the likely root cause.
- A Vynix capture can become a ready-to-build prompt or a GitHub issue assigned to a coding agent.
Frequently asked questions
Do screenshots in Vynix replace a written bug report?
No. They reduce the amount of manual explanation needed, but a short note is still useful. The best report includes the captured screenshot and element context plus one sentence about what should have happened.
Why capture the element instead of only taking a screenshot?
The selected element tells the developer what part of the page the reporter meant. That matters when several similar buttons, cards, inputs, or table rows are visible in the same screenshot.
Can Vynix send the captured context to GitHub?
Yes. From a Vynix capture, you can open a GitHub issue and assign it to a coding agent, or copy a ready-to-build prompt that includes the relevant context.
Install the widget with one script tag, point at a bug, and hand the fix to your coding agent.
Get started free