Reading the Vynix AI diagnosis and the files it finds
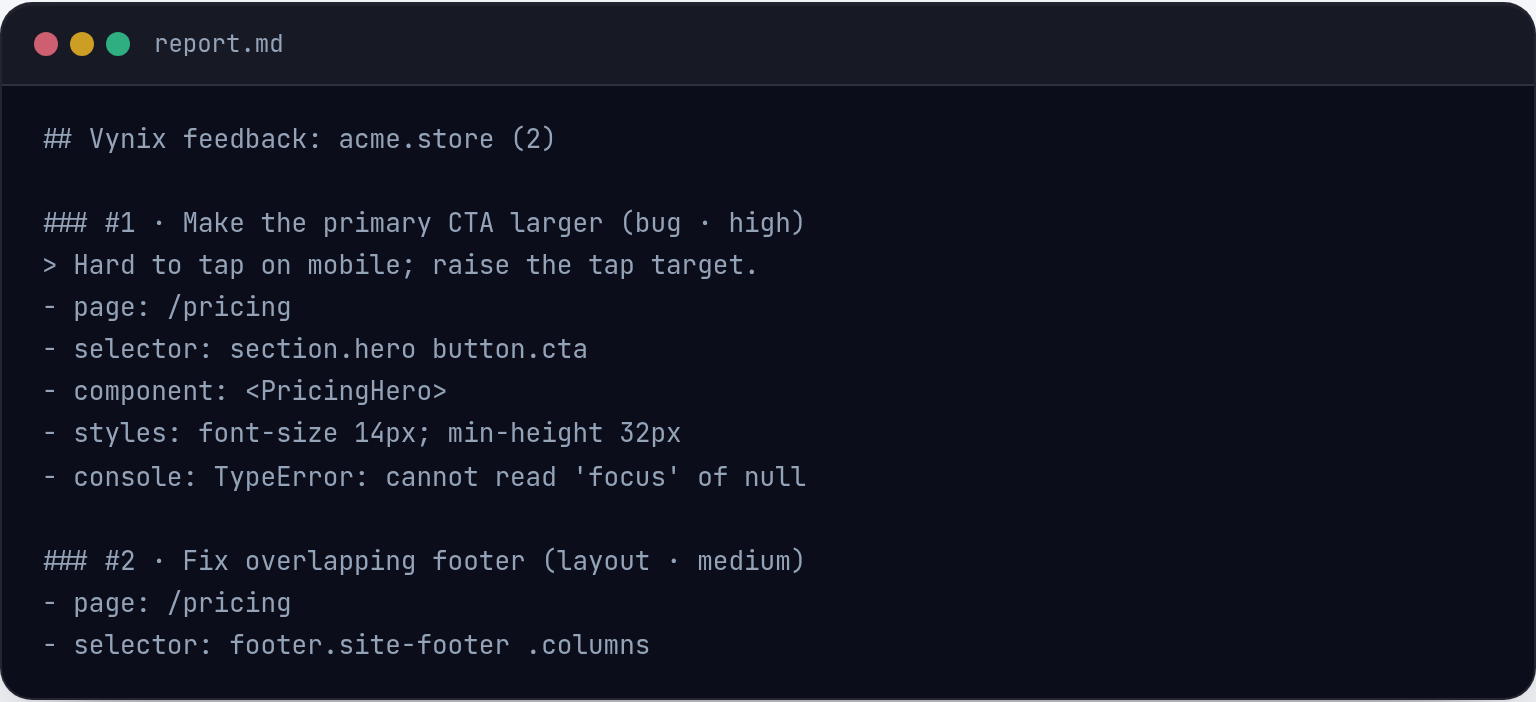
A good bug report should tell you what broke, where it broke, and what evidence supports that claim. Vynix helps by capturing the clicked element, screenshot, console and network context, then producing an AI diagnosis you can use as a starting point for a fix.
Start with the captured user action
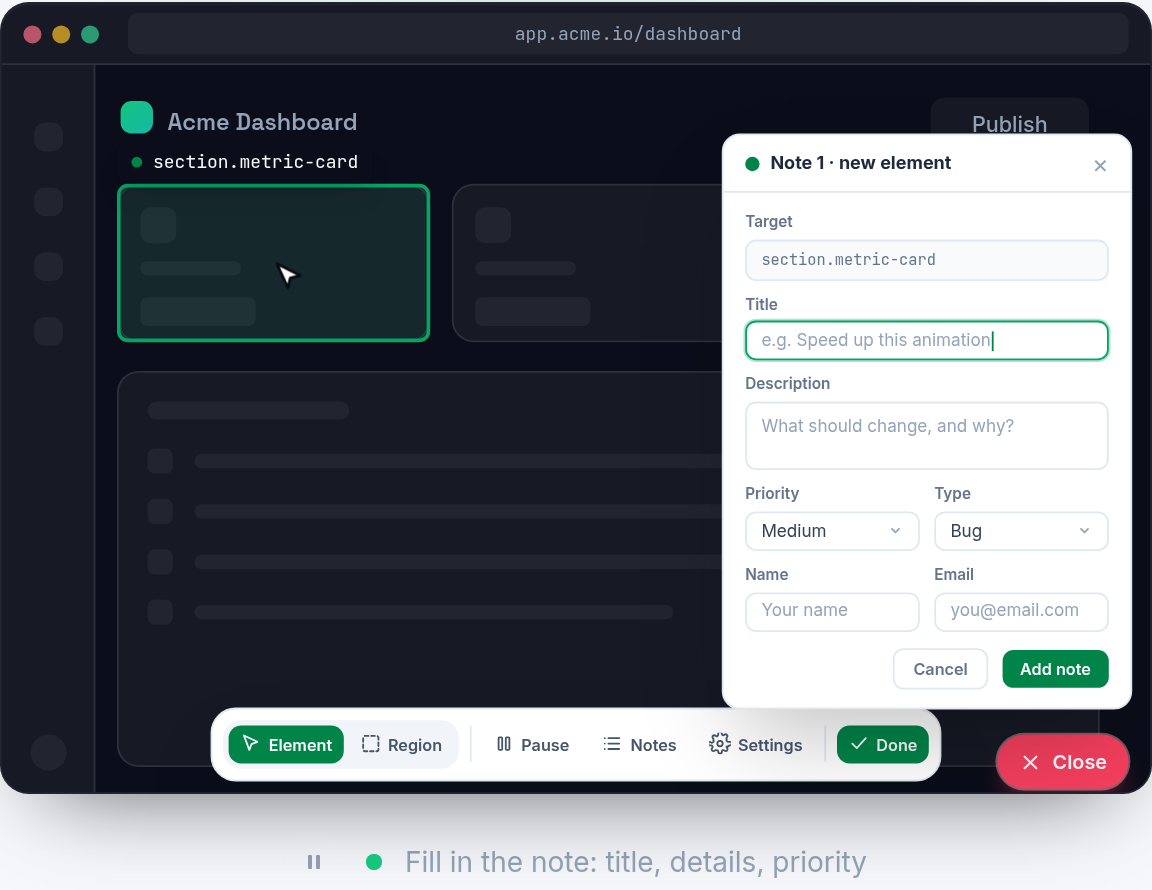
The first thing to read is not the AI text. Start with the thing the reporter clicked. Vynix is built around website annotation, so the selected element matters. If someone clicks a broken checkout button, a missing label, or a blank chart area, that click anchors the report to a real part of the page instead of a vague sentence like the page is broken.
Treat the captured element and screenshot as the plain-language problem statement. The element tells you the target. The screenshot tells you what the user saw at that moment. Before you inspect stack traces or file hints, ask a simple question: does the captured evidence match the reported issue? If the screenshot shows a disabled button but the note says the button does nothing, the issue may be validation state, not a click handler. If the element is a menu item but the screenshot shows a layout shift, the bug may live in CSS rather than routing code.
- Check the selected element first, because it defines the scope of the report.
- Use the screenshot to confirm the visible symptom, not just the expected behavior.
- Look for state clues such as disabled controls, missing data, loading spinners, or wrong copy.
Read the AI diagnosis as a hypothesis, not a verdict
The Vynix AI diagnosis is meant to summarize the likely root cause from the available context. It can connect the selected element with console errors, failing requests, and visible UI state faster than a developer reading each signal one by one. That is useful, but it is still a hypothesis. You should read it the same way you would read a careful note from another engineer: helpful, specific, and worth checking.
A strong diagnosis usually has three parts. It names the symptom, points to one or more supporting signals, and suggests a likely cause. For example, a diagnosis might connect a blank profile card to a failed request for user data and a console error caused by reading a property on undefined data. That is better than saying the component is broken, because it gives you something testable.
Be cautious when the diagnosis jumps too far beyond the evidence. If the network context shows a 500 response, the frontend may still need a loading or error-state fix, but the root cause could be server-side. If the console shows a hydration warning, the issue might be markup mismatch, browser-only code running during render, or date formatting that differs between server and client. The diagnosis should guide your next check, not replace it.
- Trust diagnoses that cite captured evidence.
- Be careful with diagnoses that sound certain but do not mention a console error, network failure, or selected element.
- Separate the visible bug from the likely code cause before assigning work.
Use console and network context to verify the story
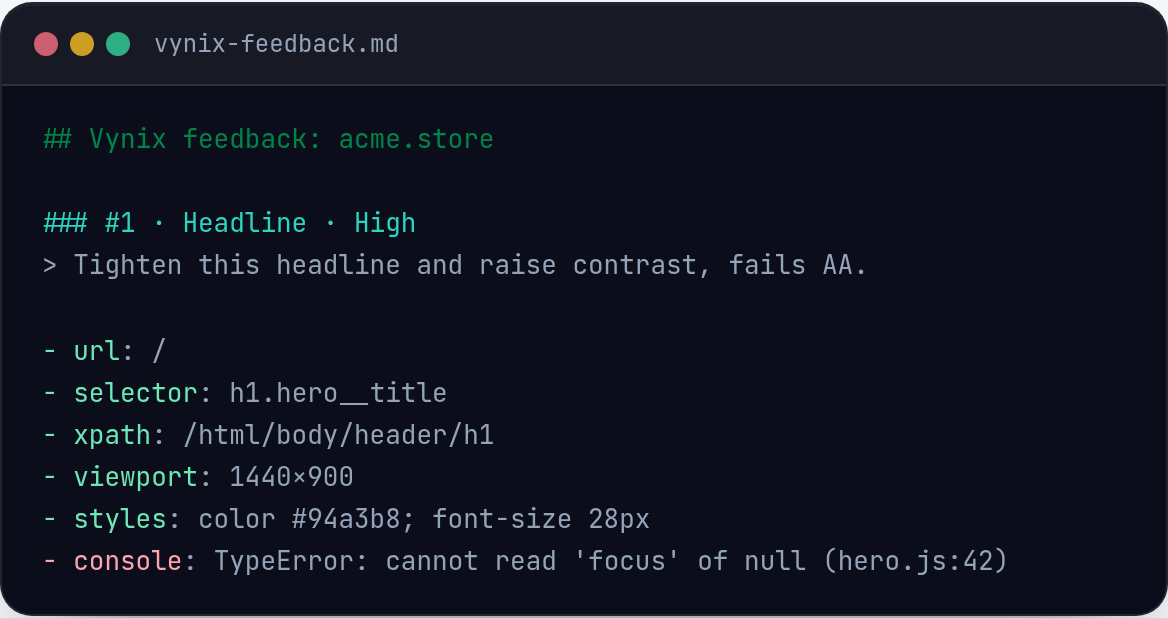
The console and network capture are where the diagnosis becomes easier to confirm. Console errors often show the first hard failure in the browser. Network entries show whether the page received the data it needed. Together, they help you distinguish between a rendering bug, a data bug, a backend response problem, and a missing asset.
Suppose the selected element is a product image placeholder. The screenshot shows a gray box. The network context shows a 404 for an image URL. The diagnosis may suggest a bad image path, a missing CDN asset, or an incorrectly mapped product field. In that case, the file hints are probably useful around the image component, product data mapping, or asset URL construction.
Now compare that with a different case. The selected element is the same placeholder, but the network request succeeds and the console logs a client-side exception right before the component renders. The likely cause has moved. You would read the diagnosis with a frontend focus and inspect where the component assumes the image object always exists. The screenshot is the same, but the evidence points to a different fix.
- Network 4xx responses often point to missing resources, bad URLs, auth problems, or invalid routes.
- Network 5xx responses often point to server-side failures, but the UI may still need better error handling.
- Console type errors often point to unchecked data shapes, missing guards, or code running before data is ready.
- Console warnings can still matter, especially when they match the visible symptom.
How to read the files Vynix points at
When Vynix includes likely files in the report or prompt context, treat them as a ranked starting set. They are not proof that the bug lives only in those files. They are the places most likely to help a developer or coding agent begin the fix without searching the whole codebase.
The best way to read file hints is to connect each file back to the captured evidence. A component file might be relevant because it renders the clicked element. A route file might be relevant because the failing page is owned there. A data-fetching file might be relevant because the network context shows a failed request. A styling file might matter because the screenshot shows a visual defect with no console or network failure.
Do not open every hinted file with the same level of attention. Start with the file that directly owns the selected element or the failing request. Then inspect nearby dependencies. If a diagnosis points to a component but the bug is actually caused by props from a parent, the first file is still useful because it shows where assumptions break.
- Rendering files answer: what produced the visible element?
- State or data files answer: where did the value come from?
- API or request files answer: why did the browser ask for this URL?
- Style files answer: why does the element look wrong even though data loaded?
- Test files answer: is there already a case that should have caught this?
Turn the diagnosis into a buildable prompt
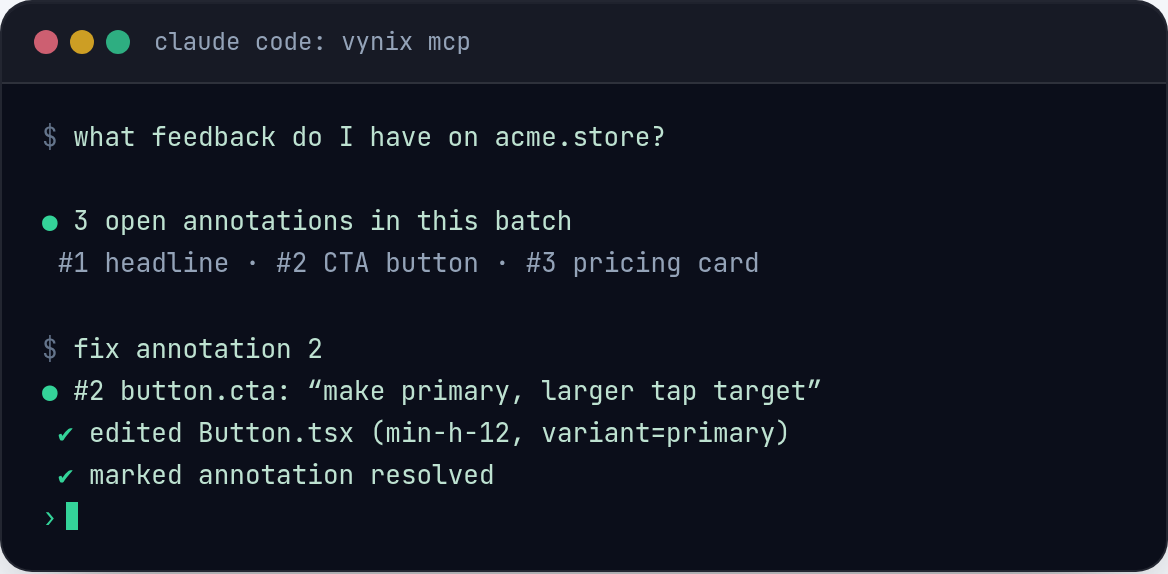
One practical use of Vynix is copying a ready-to-build prompt from the captured context. This is where you want to be precise. A vague prompt asks an agent to fix the page. A useful prompt tells the agent what the user clicked, what the screenshot showed, what the console or network evidence says, what the diagnosis suspects, and which files to inspect first.
A good prompt also includes limits. If the diagnosis suggests a frontend guard for missing data, say that the fix should preserve the existing layout and avoid hiding real API errors. If the network capture shows a failing endpoint, say whether the task is to add UI error handling, investigate request construction, or trace the backend failure. Clear boundaries reduce random edits.
Before copying the prompt into another tool, remove any uncertainty that you already resolved. If you verified that the API returns a valid response in another environment, include that note. If you reproduced the issue only when logged out, include that too. Vynix gives you the captured context, but your short human clarification can save several back-and-forth comments.
- Describe the clicked element and visible symptom.
- Include the most relevant console and network signals.
- Name the suspected cause as a hypothesis.
- List the likely files in inspection order.
- State what a correct fix should change and what it should not change.
Open a GitHub issue without losing the evidence
If the issue needs to be tracked, Vynix can help you open a GitHub issue and assign it to a coding agent. The goal is not just to create a ticket. The goal is to preserve the useful debugging context at the moment the bug was seen. Screenshots, selected elements, console output, and network clues are much harder to reconstruct later.
When you review the issue text, make sure it reads like a work order. The title should name the symptom, not the suspected implementation detail unless you are sure. For example, profile card stays blank after user data loads is better than fix UserProfileCard bug. The body should keep the diagnosis and file hints, but it should also make the acceptance criteria plain.
For a small UI bug, acceptance criteria might be simple: the button remains visible at mobile width, the label is not clipped, and no new console errors appear. For a data bug, criteria might include loading, empty, success, and error states. A coding agent can work faster when the issue tells it how the fix will be judged.
- Keep the screenshot and selected element context attached to the issue.
- Do not delete the AI diagnosis, but label uncertain parts as likely or suspected.
- Add reproduction details if the capture alone does not explain them.
- Write acceptance criteria that can be checked in the browser.
- Read the selected element and screenshot first, because they define the actual user-facing problem.
- Treat the AI diagnosis and file hints as evidence-based hypotheses that still need verification.
- When creating a prompt or GitHub issue, keep the console, network, screenshot, diagnosis, file hints, and acceptance criteria together.
Frequently asked questions
Should I trust the Vynix AI diagnosis?
Use it as a strong starting point, not as final proof. The diagnosis is most useful when it ties the visible symptom to captured evidence such as console errors, failed network requests, or the selected element.
What if the files Vynix finds are not the real source of the bug?
That can happen. Treat file hints as an inspection order. Start with the files closest to the clicked element or failing request, then follow props, data flow, imports, routes, or API calls until the evidence matches the cause.
What should I add before assigning a GitHub issue to a coding agent?
Add any reproduction detail that Vynix could not infer, such as account state, browser conditions, feature flags, or environment differences. Also add clear acceptance criteria so the agent knows when the fix is complete.
Install the widget with one script tag, point at a bug, and hand the fix to your coding agent.
Get started free