Point and click feedback on any web page
Most website feedback loses the details developers need. Vynix lets a tester, teammate, or client point at the broken part of a page, capture the surrounding technical context, and turn it into work a developer or coding agent can start from.
Why web feedback gets stuck
A typical bug report for a website starts with a sentence like, "The button does not work." That is not useless, but it is not enough. A developer still needs to know which button, on which page, in which browser state, after which action, and whether the failure showed up in the console or the network tab. The person reporting the issue may not know how to collect those details, and asking for them later slows everyone down.
Screenshots help, but they often leave out the most important parts. A screenshot can show that a checkout total is wrong, but it cannot show the failed API request that returned stale data. A Loom video can show the steps, but the developer still has to scrub through it, guess the selector, and reproduce the state. Browser DevTools can answer many of these questions, but only if the reporter knows how to use them and captures the right moment.
Vynix is built for the gap between "I see something wrong" and "I have enough context to fix it." Instead of turning every reporter into a developer, it brings the developer context into the feedback flow.
How point and click annotation works
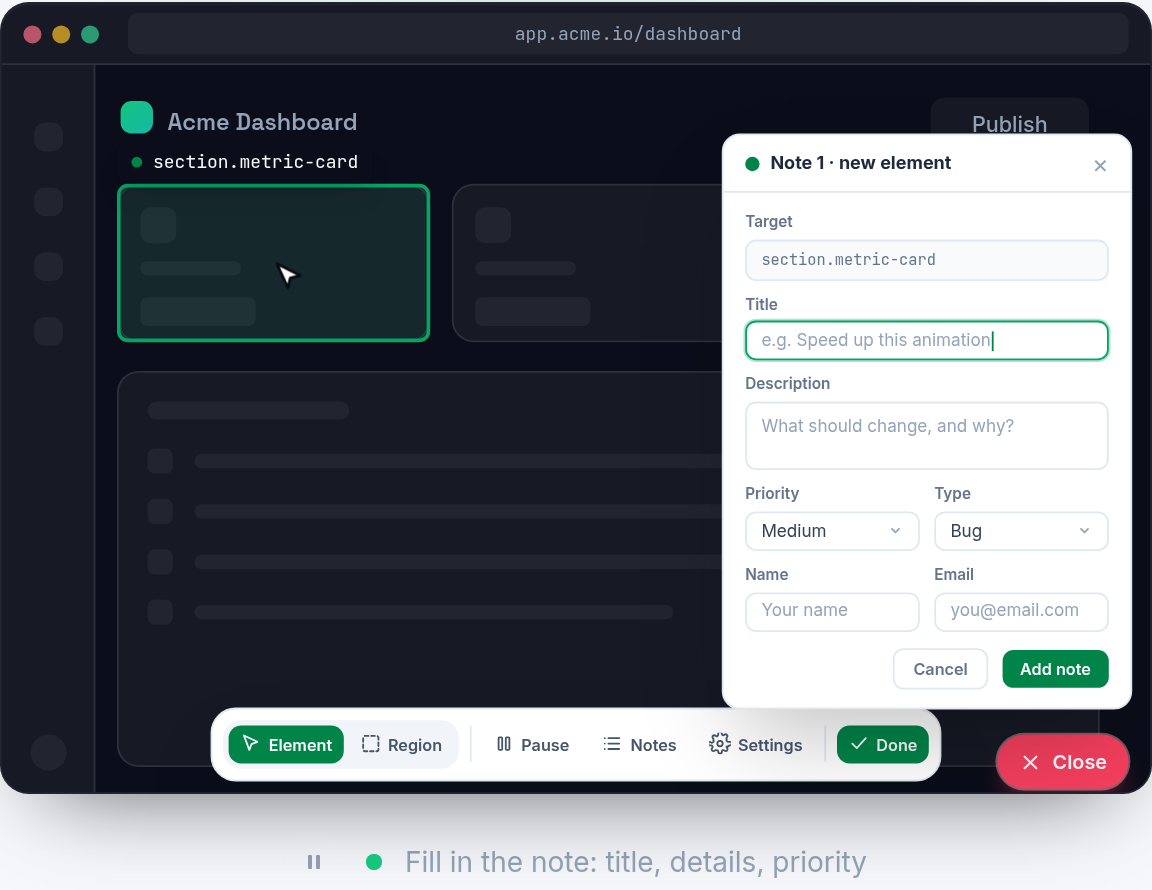
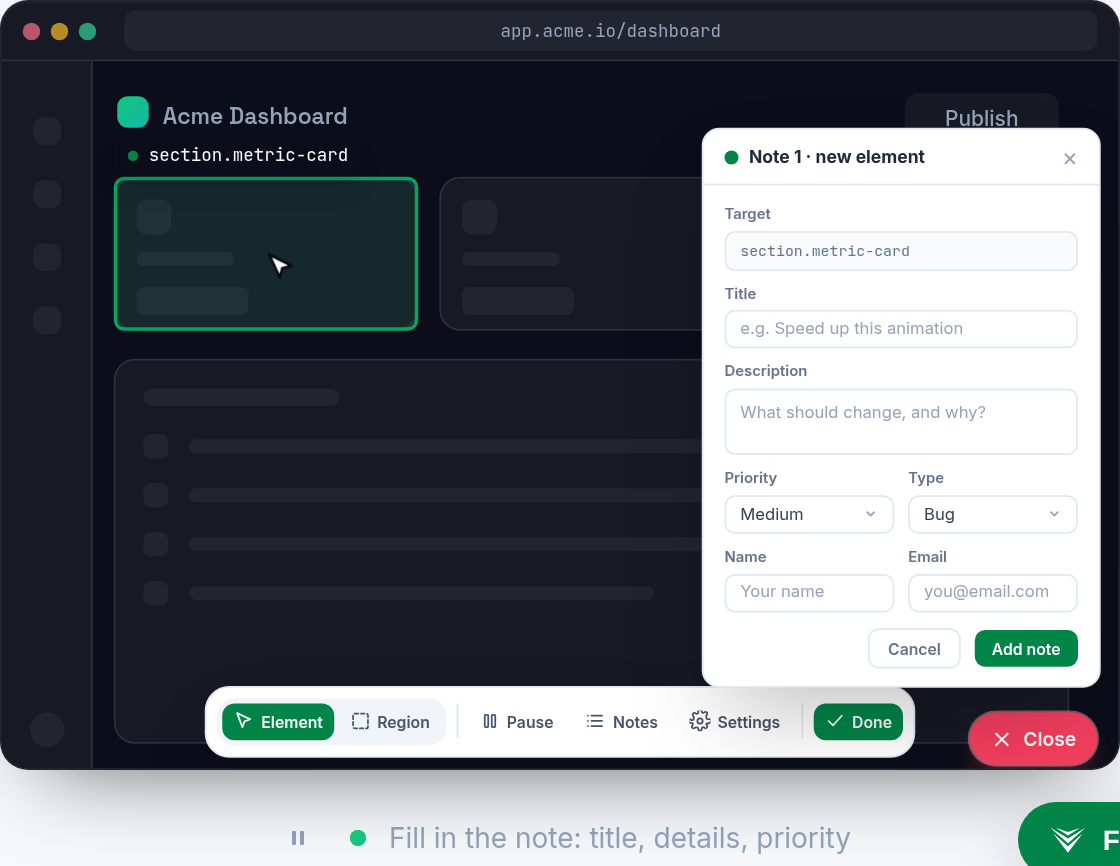
With Vynix, you drop a lightweight widget on a site. When someone spots an issue, they open the widget and click the part of the page that is wrong. That click matters because it anchors the report to a real element, not just a vague description of the page.
For example, imagine a product card where the sale badge overlaps the product name on mobile. A tester can tap the overlapping text, describe what looks wrong, and submit the report. Vynix captures the selected element, a screenshot, console context, network context, and an AI diagnosis of the likely root cause. The developer who receives it can see the visual symptom and the technical clues in one place.
This is different from a generic feedback form. The page itself becomes the input surface. People do not need to copy URLs, inspect HTML, or explain where the issue lives with phrases like "near the top right, under the hero image." They click what they mean.
- The clicked element gives the report a precise target.
- The screenshot preserves what the reporter saw at that moment.
- Console and network context help explain what the page was doing behind the UI.
- The AI diagnosis gives the developer a first-pass explanation, not just a raw dump of data.
What Vynix captures for developers
Good bug reports combine human observation with machine context. The human can say, "This menu opens behind the header." The browser can show that a CSS stacking rule, a failed request, or a JavaScript error may be involved. Vynix connects those two views.
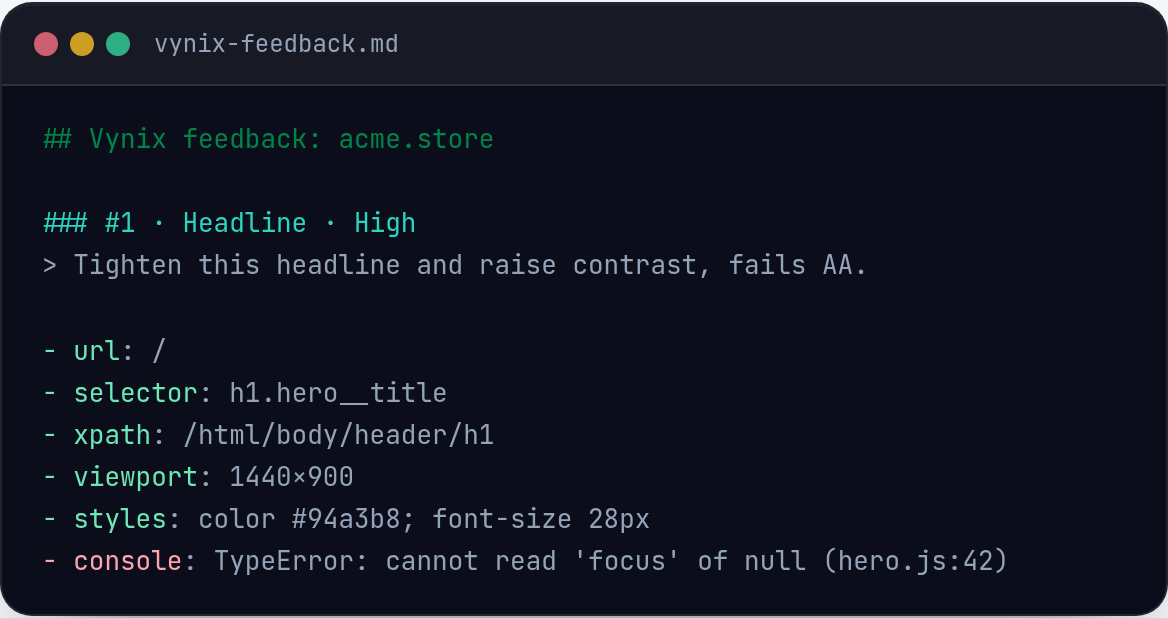
The element capture is useful when the issue is visual or interaction-related. If a button is disabled, a label is clipped, or a modal does not close, the selected element gives the developer a starting point in the DOM. The screenshot gives the visual evidence, including layout, surrounding content, and the state of the page.
Console context matters because many web failures leave traces there. A React hydration warning, an uncaught TypeError, or a failed event handler can explain why a component looks fine but does not respond. Network context matters for issues tied to data. A 401 response, a slow endpoint, or an unexpected payload can make a UI look broken even when the component code is not the main problem.
The AI diagnosis does not replace debugging. It summarizes the likely root cause from the available evidence so the next person has a useful starting point. That can save time, especially when a coding agent is going to pick up the task and needs a clear prompt.
- UI context: the selected element and screenshot.
- Runtime context: console messages around the issue.
- Data context: relevant network activity.
- Reasoning context: an AI diagnosis of the likely cause.
From feedback to a buildable task
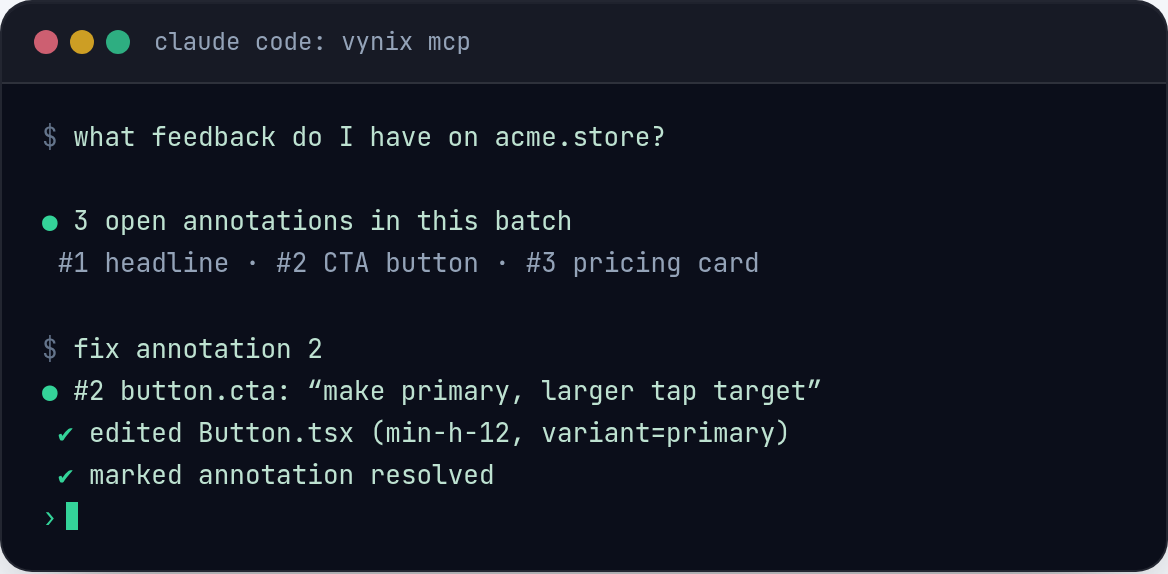
Capturing context is only half the job. The other half is turning that context into something a developer can act on. Vynix helps by letting you copy a ready-to-build prompt or open a GitHub issue and assign it to a coding agent.
That workflow fits how many teams now handle small web fixes. A human notices the problem, Vynix gathers the evidence, and the output becomes a task with enough detail to start implementation. The developer or agent does not begin with a blank page. They begin with a clicked element, a screenshot, console and network context, and a diagnosis to verify.
Consider a bug where a "Save" button appears to work but the updated value disappears after refresh. Without context, the task might say, "Saving is broken on settings." With Vynix, the task can include the exact control that was clicked, the relevant network call, the response behavior, and a note that the likely issue is in the save request or state refresh path. That is much closer to a buildable task.
The goal is not to make every report perfect. The goal is to reduce the repeated back-and-forth that happens before work can even start.
Where this helps most
Point and click feedback is useful anywhere the person who sees a problem is not the same person who will fix it. That includes QA reviews, design reviews, client staging sites, internal tools, and production support. The workflow is especially helpful when the bug is visible in the browser but hard to explain in text.
Designers can click spacing, alignment, and responsive issues without writing CSS guesses. QA testers can mark a broken form field and send the browser context along with the reproduction note. Product managers can flag confusing states in a staging build without interrupting a developer to screen-share. Support teams can capture a user-facing problem while the relevant errors and requests are still fresh.
It also helps with issues that only appear in a certain state. A cart with a discount code, an admin table filtered to a specific record, or a settings page after a failed validation attempt can be annoying to recreate. A report that includes the page state and technical context gives the assignee a better chance of understanding what happened.
- Visual bugs, such as overlap, clipping, missing styles, or mobile layout problems.
- Interaction bugs, such as clicks that do nothing or menus that close at the wrong time.
- Data bugs, such as empty states, stale values, or failed saves.
- Review comments, such as copy issues or design details tied to a specific element.
How to write better reports with Vynix
Vynix captures a lot automatically, but the human note still matters. The best reports describe what the reporter expected, what actually happened, and any step that is not obvious from the page state. A short, specific note beats a long, uncertain one.
For example, "Expected the coupon to reduce the total by 10 percent, but the total stayed the same after clicking Apply" is better than "Coupon bug." It tells the assignee what the user wanted, what action was taken, and what result looked wrong. Vynix then adds the clicked element, screenshot, console and network context, and likely cause.
It also helps to click the most relevant element. If a form error appears under an email input, click the email input or the error text, not the whole page. If a table row shows the wrong status, click that row or the status label. This keeps the captured context focused.
A good report does not need to be long. It needs to point at the right place and preserve the right evidence.
- Write the expected result and the actual result.
- Mention the last action you took before the problem appeared.
- Click the element closest to the issue.
- Avoid guessing at the fix unless you are sure. Let the captured context support the diagnosis.
- Vynix turns vague website feedback into element-specific reports with screenshots and browser context.
- Console, network, and element data help developers understand likely causes without asking for repeated follow-up details.
- Teams can move from a clicked problem on the page to a GitHub issue or coding-agent prompt that is ready to work on.
Frequently asked questions
Does Vynix replace a bug tracker?
No. Vynix helps capture website feedback with developer context and can open a GitHub issue. It is best understood as the layer between seeing a web problem and creating a task that someone can build from.
Do reporters need to know how to use DevTools?
No. Reporters can click the part of the page that is wrong and add a plain-language note. Vynix captures technical context such as the element, screenshot, console context, and network context.
Can Vynix help coding agents?
Yes. Vynix can produce a ready-to-build prompt or open a GitHub issue and assign it to a coding agent, using the captured page context and AI diagnosis as a starting point.
Install the widget with one script tag, point at a bug, and hand the fix to your coding agent.
Get started free