How Vynix Works, From a Click to a Fix
A vague bug report can cost more time than the bug itself. Vynix shortens that path by letting you click the broken part of a website and capture the context a developer or coding agent needs to start fixing it.
Why bug reports lose useful context
Most website bugs start with a sentence like, The checkout button is broken, or The layout looks wrong on the product page. That may be true, but it is not enough to build from. A developer still needs to know which page, which element, what the browser saw, whether a request failed, and whether the console already explains the problem.
The missing details create a loop. A developer asks for a screenshot. The reporter adds one. The developer asks what happened in the console. The reporter does not have DevTools open. Someone tries to reproduce the issue, but their local data is different. Vynix is designed for the moment when the issue is visible on the page, before that context disappears.
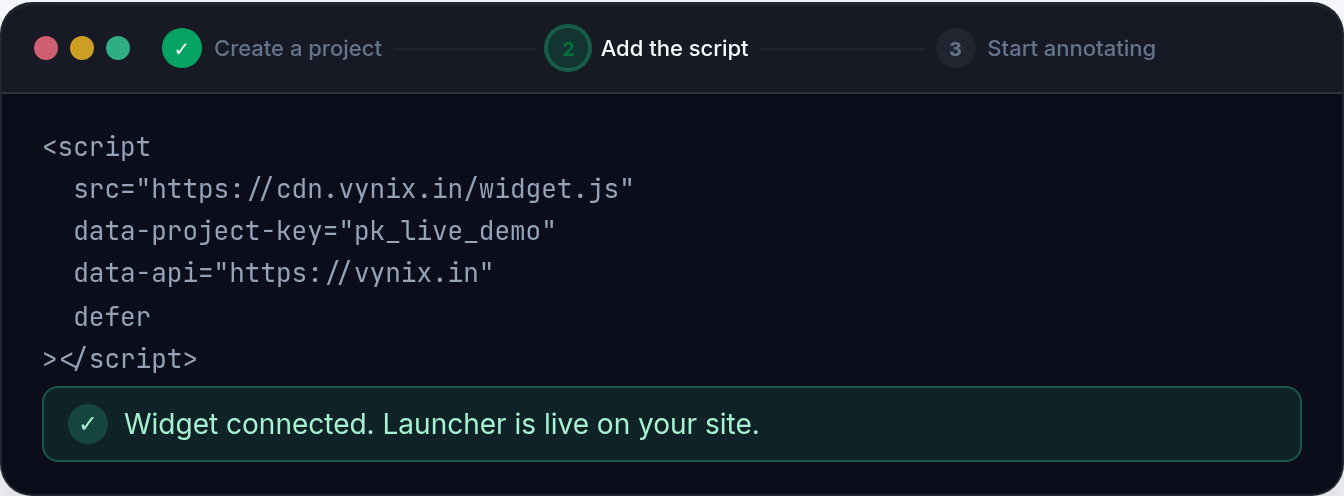
Step 1: Add the widget to the site
Vynix starts as a lightweight widget added to the website you want to review. Once it is present, testers, product managers, designers, support staff, or developers can use it while looking at the real page. The point is not to create a separate reporting flow. The report begins where the issue appears.
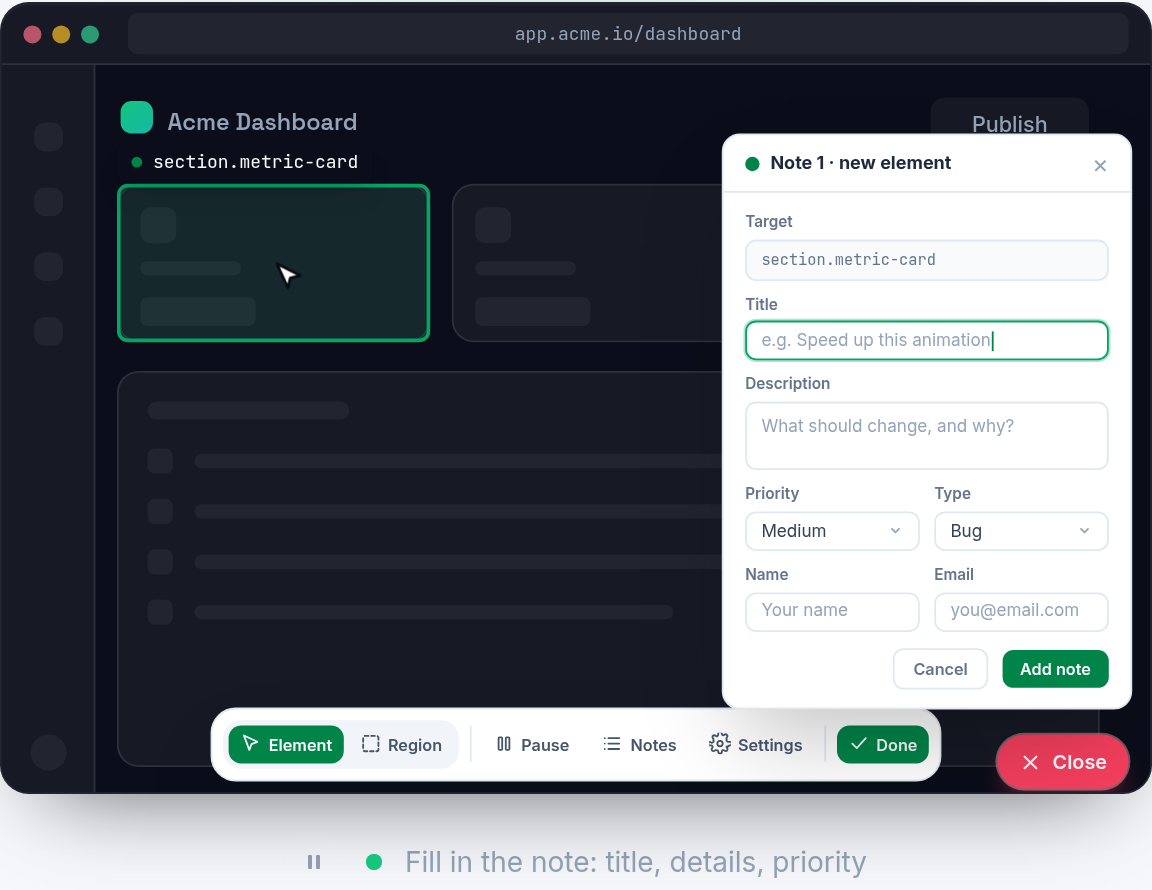
For example, say a product card has a price label overlapping the image on a staging site. Instead of writing a ticket from memory, the reviewer opens Vynix and clicks the broken price label. That click gives the report a target. It tells Vynix which part of the page matters and anchors the rest of the captured context to a specific element.
- Use the widget on the site where the problem is visible.
- Click the element that best represents the issue, such as a button, form field, image, label, or menu item.
- Capture the issue while it is happening, not after refreshing or trying to describe it from memory.
Step 2: Click what is wrong
The click is the key action. Vynix is built around the idea that a website issue usually has a visible anchor, even when the root cause is elsewhere. A disabled-looking submit button, a modal that will not close, a blank product grid, or a broken navigation link all give the tool a place to start.
This matters because the clicked element narrows the problem. If a page has twenty buttons and only one fails, the report should not make a developer hunt through all twenty. When Vynix captures the selected element, it helps connect the visible symptom to the related screenshot, console entries, network activity, and AI diagnosis.
Step 3: Vynix captures the evidence
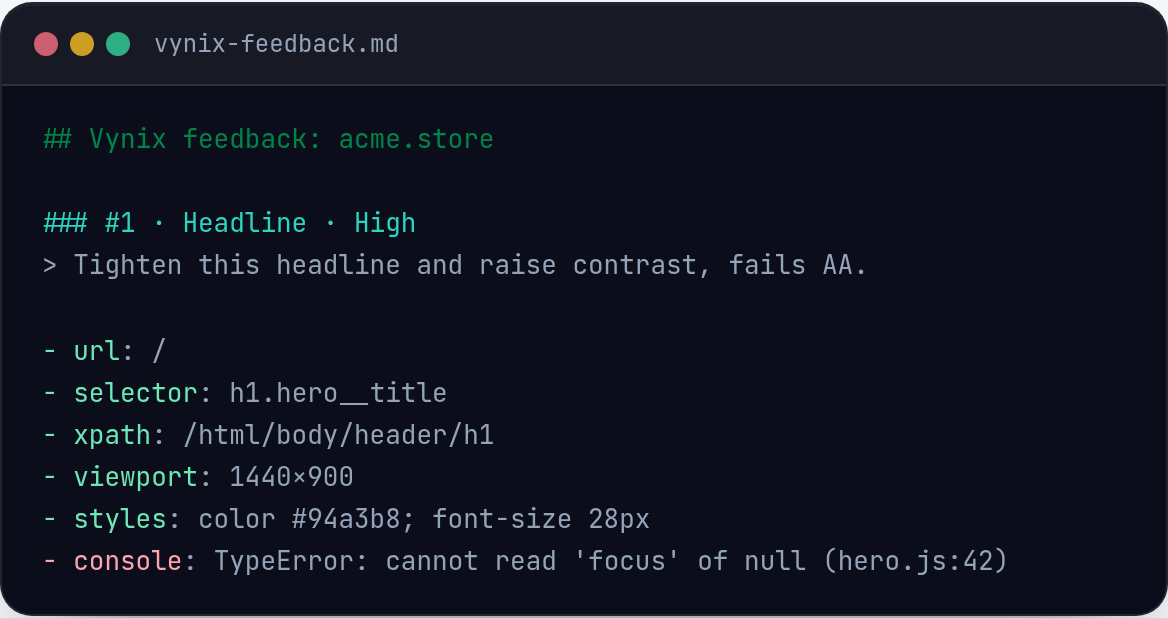
After the click, Vynix gathers the evidence that usually takes several back-and-forth messages to collect. It captures the element, a screenshot, console context, network context, and an AI diagnosis of the likely root cause. Each piece answers a different question a developer would normally ask during triage.
Imagine a checkout form where the Place order button does nothing. The screenshot shows the visible state. The selected element identifies the button. The console may show a JavaScript error triggered by the click. The network context may show a failed request or a response that does not match what the front end expects. The AI diagnosis can then summarize the likely cause in practical language.
- Element capture shows what the reporter clicked, so the issue is tied to a specific part of the page.
- Screenshot capture preserves the visual state, including layout, text, and visible error messages.
- Console context helps reveal JavaScript errors, warnings, or failed runtime assumptions.
- Network context helps show failed or unexpected requests related to the page behavior.
- AI diagnosis gives a likely root cause so the next person does not start with a blank page.
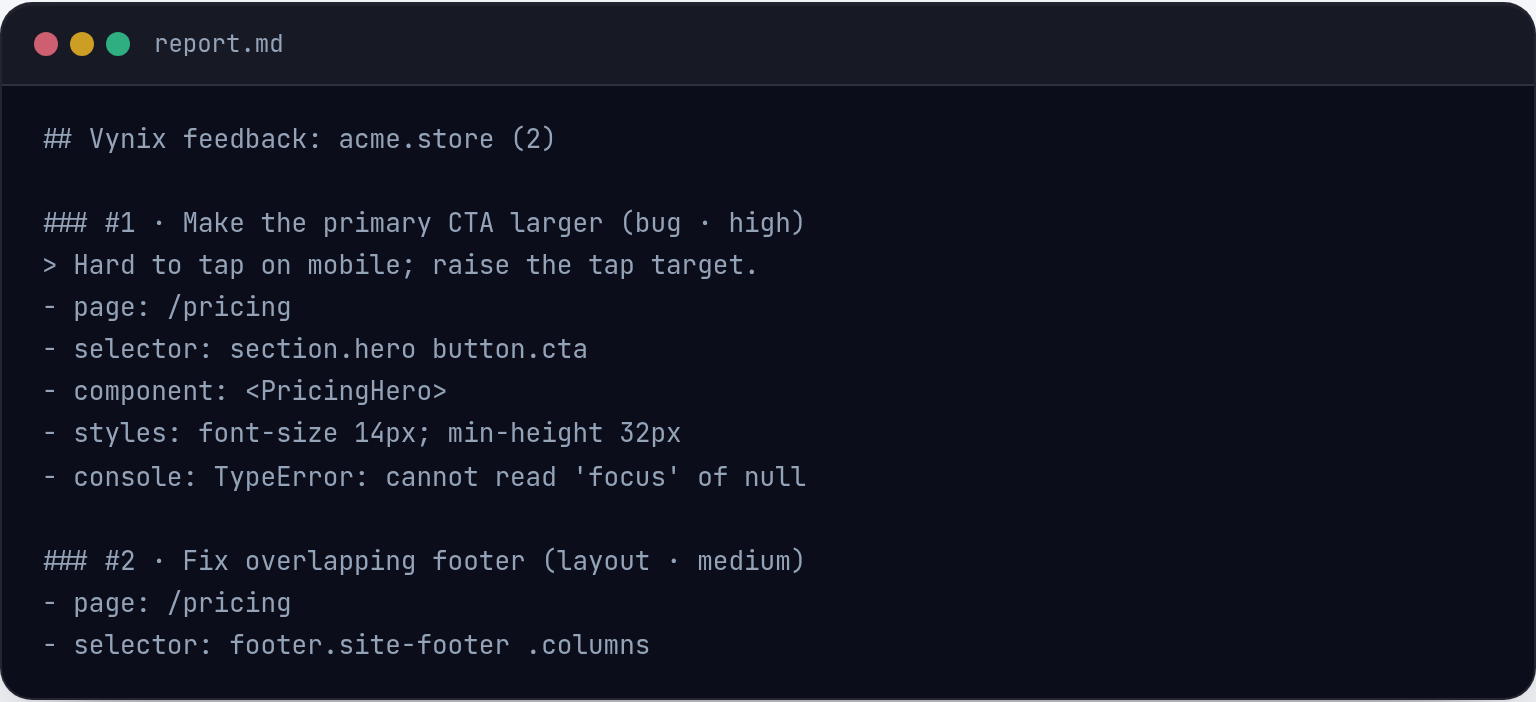
Step 4: The report becomes developer context
A useful report is not just a complaint. It is a bundle of context that points toward a fix. Vynix turns a page interaction into that bundle, which helps a developer decide whether the issue belongs in the front end, the API, the data layer, or the integration between them.
Consider a product search page that returns no results for a query that should match several items. A plain report might say, Search is broken. A Vynix report can show the empty results area, the selected element, the screenshot, console output, and network context. If the request returned a 200 response with an empty array, the likely next step is different than if the request failed with a 500 or never fired at all.
- A visual layout bug may point to CSS, responsive rules, or component state.
- A button that does nothing may point to an event handler, validation state, or blocked request.
- A blank area may point to missing data, a failed network call, or a rendering error.
- A form error may point to mismatched field names, validation logic, or an API response shape.
Step 5: Move from diagnosis to buildable work
Once the context is captured, Vynix gives you two practical paths. You can copy a ready-to-build prompt, or you can open a GitHub issue and assign it to a coding agent. Both options are meant to preserve the useful details from the page and turn them into something actionable.
The copied prompt can be used with the coding workflow your team already prefers. The GitHub issue path is useful when your team tracks work there and wants the problem recorded as a task. Assigning the issue to a coding agent can help start the implementation work, but the context still matters. A better input gives the agent a better chance of changing the right code.
- Copy the ready-to-build prompt when you want to bring the context into an AI coding tool or chat-based workflow.
- Open a GitHub issue when the problem should live in your normal project queue.
- Assign the issue to a coding agent when your team wants an agent to start from the captured context.
- Keep human review in the loop for code changes, edge cases, and product decisions.
How to get the best results from Vynix
The best reports come from clicking the most specific broken thing. If a menu item is clipped, click that item, not the whole header. If a Save button fails after entering an invalid value, reproduce the failure and click the button or the visible error state. If an image is missing, click the empty slot where the image should be.
Vynix is not a replacement for understanding the codebase, reviewing changes, or testing the fix. It is a way to collect the right evidence at the right time and hand it to the person or agent doing the work. That keeps teams out of the slow cycle of vague tickets, missing screenshots, and repeated requests for console logs.
- Vynix turns a click on a broken website element into a report with visual, console, network, and AI-diagnosed context.
- The captured context helps developers and coding agents start from evidence instead of vague descriptions.
- Teams can copy a ready-to-build prompt or open a GitHub issue and assign it to a coding agent without losing the page context.
Frequently asked questions
Does Vynix automatically fix the bug?
No. Vynix captures the element, screenshot, console and network context, and an AI diagnosis. From there, you can copy a ready-to-build prompt or open a GitHub issue and assign it to a coding agent.
What should I click when reporting an issue?
Click the most specific visible part of the problem. For example, click the broken button, clipped label, empty image slot, failing form field, or visible error message.
Is Vynix only for developers?
No. Anyone who can see the issue on the site can use the widget to capture it. Developers still benefit because the report includes technical context they would otherwise have to request manually.
Install the widget with one script tag, point at a bug, and hand the fix to your coding agent.
Get started free