How Vynix Captures Console and Network Detail
Most website bugs are reported with too little context. Vynix helps by capturing what the user clicked, what the browser showed, and what the console and network were doing at the moment the issue was reported.
Why console and network context matters
A bug report like "the checkout button is broken" sounds simple, but it usually hides the useful part. Did the click handler fail? Did an API call return a 500? Was the button disabled because a validation request never finished? Without browser context, a developer has to reproduce the issue, open DevTools, repeat the same path, and hope the same failure happens again.
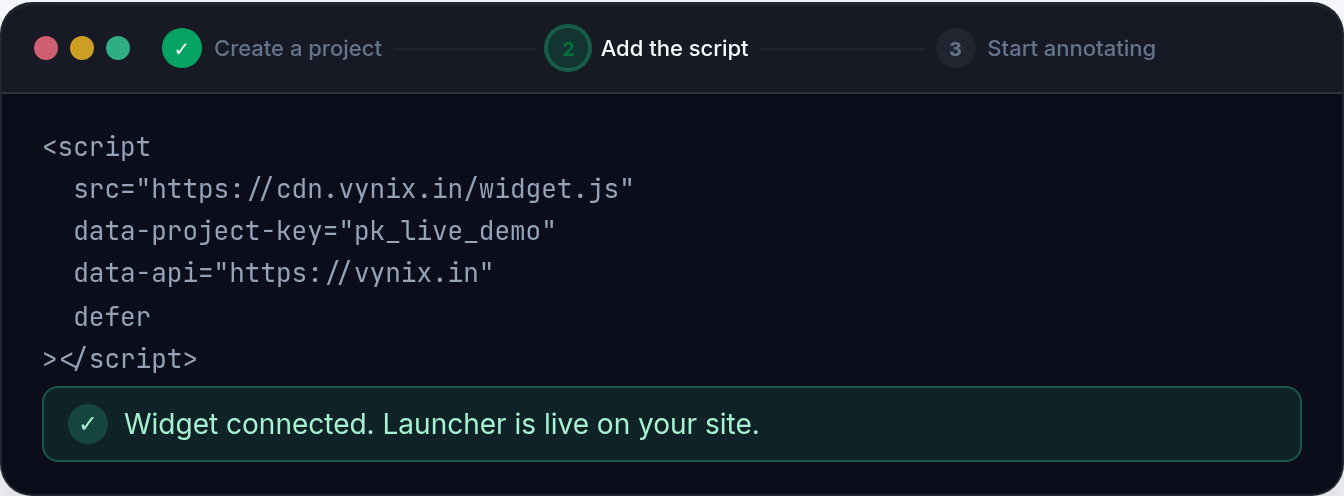
Vynix is built around a different workflow. You add a lightweight widget to the site, click on what is wrong, and Vynix captures the page state around that report. That includes the selected element, a screenshot, console and network context, and an AI diagnosis of the likely root cause. The goal is not to replace debugging. The goal is to start debugging from the evidence instead of from a vague sentence.
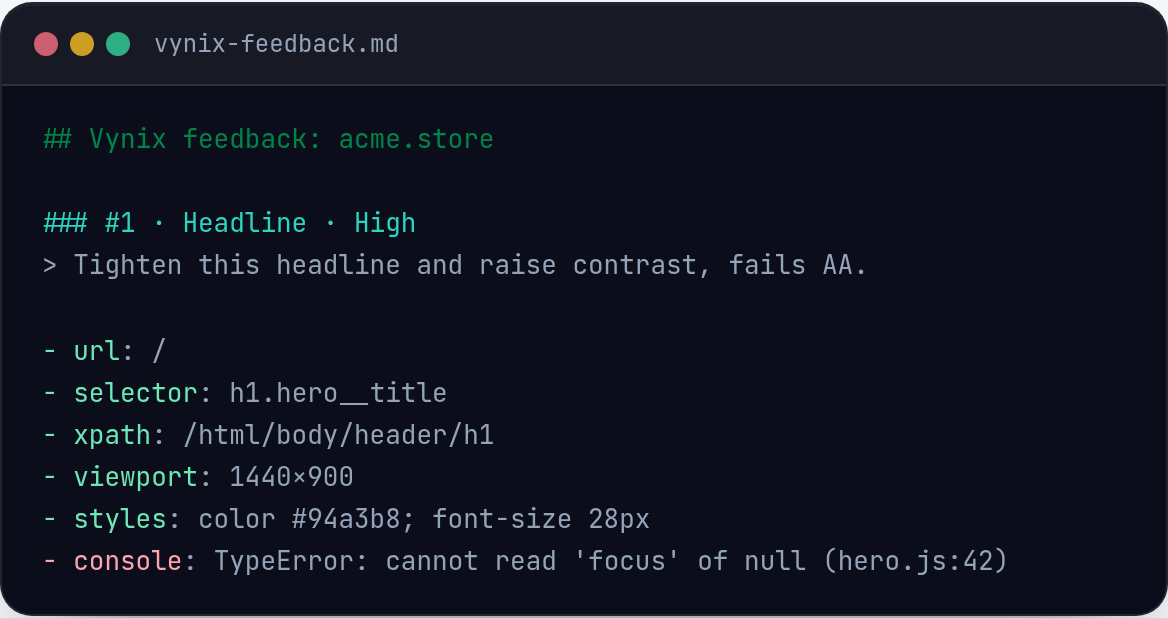
- Console output can show JavaScript exceptions, failed assertions, warnings, and noisy dependency errors.
- Network context can show whether the UI was waiting on an API request, loading a missing asset, or receiving an unexpected response.
- A screenshot and selected element tie that technical detail to the exact part of the page the reporter saw.
What happens when someone reports an issue
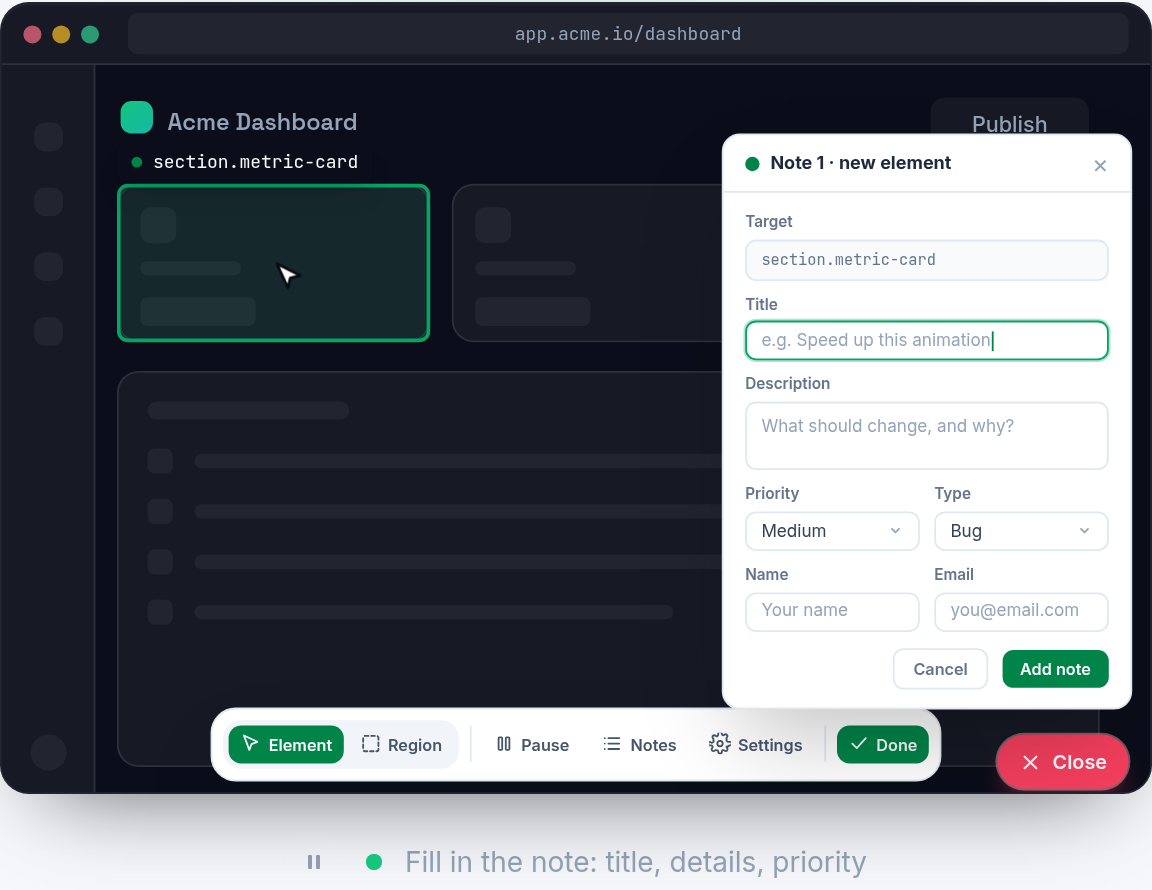
The Vynix flow starts with the person who sees the problem. Instead of writing a long description or switching tools, they click the Vynix widget on the site and select the thing that looks wrong. That click matters. It gives the report an anchor in the DOM instead of making the developer guess which button, input, card, modal, or table row the report means.
At that point Vynix packages the visible problem with browser-side context. The screenshot shows what the reporter saw. The captured element gives developers a concrete target. The console and network context show what was happening in the browser around the time of the report. Vynix then adds an AI diagnosis that summarizes the likely root cause, so the developer or coding agent has a better first prompt than "please investigate".
From there, the report can move straight into implementation work. You can copy a ready-to-build prompt or open a GitHub issue and assign it to a coding agent. The important part is that the task starts with evidence from the actual page, not a hand-written recreation of the symptoms.
How console capture reduces back-and-forth
Console logs are often the first clue when a website fails in the browser. A React render error, an undefined property, a blocked script, or a failed feature flag check may show up there before the UI gives a clear message. In a normal bug report, that data is easy to lose because the reporter may not know how to open DevTools, copy logs, or filter the noise.
Vynix captures console context for the report so the developer can see relevant browser messages without asking the reporter to reproduce the bug under instruction. That is especially useful when the issue is intermittent. If the console only shows the error once, at the moment a component mounts or a request finishes, the report still carries that clue forward.
Good console context also helps separate UI problems from data problems. For example, if a profile page shows a blank panel and the console includes "Cannot read properties of undefined", the likely starting point is a front-end assumption about missing data. If the console is clean but the network context shows an API error, the investigation starts somewhere else.
- It cuts down on requests like "can you open DevTools and send the console output?"
- It preserves transient errors that may disappear after a refresh.
- It gives coding agents more specific input than a screenshot alone.
How network context points to the failing layer
Many visible website bugs are really request problems. A spinner that never stops may be waiting on a slow endpoint. A pricing card may be empty because a JSON response changed shape. A missing image may come from an asset path that works locally but not in production. Network context helps developers decide whether they should inspect the component, the API, the CDN, authentication, or a recent deployment.
When Vynix includes network context in a report, it gives the developer a view of what the page was trying to load around the time of the issue. That context is useful because browser behavior can differ by route, user state, environment, and timing. A failed request tied to the selected UI element is much easier to act on than a generic report that says "data did not load".
Consider a dashboard where one chart is blank. The screenshot shows the empty chart area. The selected element tells the developer which chart. The network context may show a failed request for that chart's data. The console may show a downstream rendering error after the failed request. The AI diagnosis can then point to the likely path: the chart component is not handling the failed or missing response correctly.
- Status and timing clues can show whether a request failed, stalled, or returned too late for the UI state.
- Missing asset requests can explain broken icons, fonts, images, and script-dependent features.
- API failures can explain empty tables, disabled buttons, stuck loaders, and mismatched page state.
Why the selected element matters as much as the logs
Console and network detail are powerful, but they are not always self-explanatory. A busy page can produce many logs and requests that are unrelated to the thing the reporter noticed. The selected element narrows the report. If someone clicks the broken "Save address" button, the developer does not have to scan the whole page and infer intent.
This is where Vynix differs from a generic screenshot or a copied console dump. The report links the human observation to technical context. The screenshot answers "what did it look like?" The element answers "where was it?" The console and network context answer "what was the browser doing?" The AI diagnosis uses those pieces to suggest a likely root cause that a developer can confirm, reject, or refine.
That combination is also useful for coding agents. Agents perform better when the task includes the relevant UI target, observed behavior, and technical signals. A prompt that says "fix the broken save button on the account page" is weak. A prompt that includes the selected element, screenshot, console error, network clue, and suspected cause gives the agent a much better starting point.
Turning captured context into build-ready work
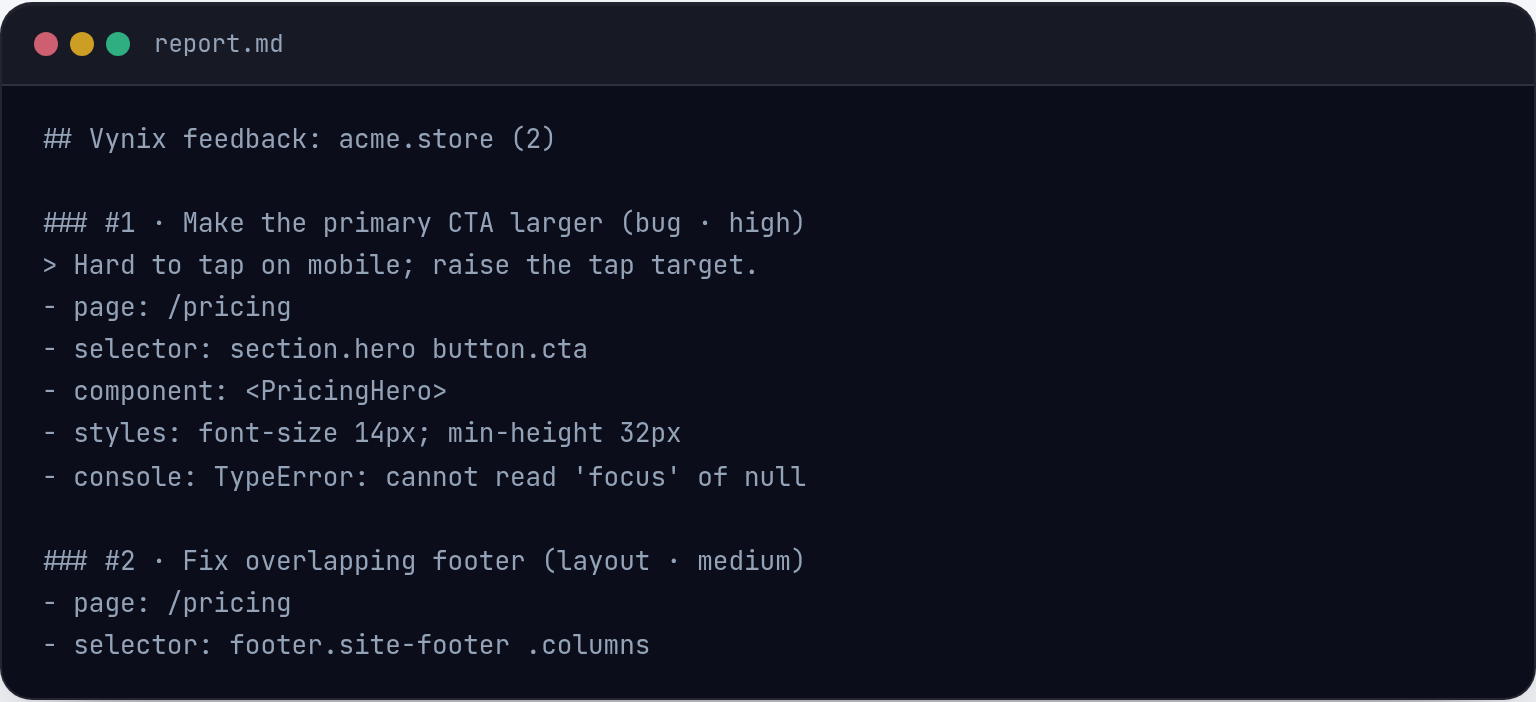
Capturing context is only useful if it reaches the place where work happens. Vynix lets you copy a ready-to-build prompt or open a GitHub issue and assign it to a coding agent. That keeps the report from becoming a loose note in chat or a screenshot that someone has to translate into an engineering task later.
A strong issue created from Vynix context can include the visible problem, the relevant page area, captured browser signals, and the AI diagnosis. The developer still owns the fix. They still review the code, test the change, and decide whether the diagnosis is correct. But they start with a richer report than they would get from most feedback tools.
The practical result is less back-and-forth. Product, QA, support, and engineering can talk about the same captured evidence. If the issue is a front-end exception, the console context helps show it. If it is an API problem, the network context helps point there. If it is a mismatch between expected and actual UI state, the screenshot and selected element keep the conversation grounded.
- Use the copied prompt when you want to send a focused task to an AI coding workflow.
- Open a GitHub issue when the work needs tracking, assignment, review, and history.
- Keep the AI diagnosis as a starting point, not as a substitute for engineering judgment.
- Vynix captures the selected element, screenshot, console context, network context, and an AI diagnosis when someone reports a website issue.
- Console and network detail help developers identify whether a bug likely starts in the UI, an API request, an asset load, or another browser-side failure.
- Captured context can be turned into a ready-to-build prompt or a GitHub issue for a developer or coding agent to act on.
Frequently asked questions
Does Vynix replace browser DevTools?
No. DevTools is still where developers inspect, reproduce, and verify issues in detail. Vynix helps capture useful console, network, screenshot, and element context at the moment a problem is reported, so the developer starts with better evidence.
Can Vynix create work for a coding agent?
Yes. After Vynix captures the issue context and AI diagnosis, you can copy a ready-to-build prompt or open a GitHub issue and assign it to a coding agent.
Why is selecting the broken element important?
Selecting the element connects the report to the exact part of the page that looked wrong. That makes the console and network context easier to interpret because the developer knows which UI behavior the report is about.
Install the widget with one script tag, point at a bug, and hand the fix to your coding agent.
Get started free